Multi-node inference load balancing#
This guide describes how to set up a scalable, high-performance multi-node LLM inference cluster using AMD GPUs, supporting efficient horizontal scaling and highly available deployments.
Architecture overview#
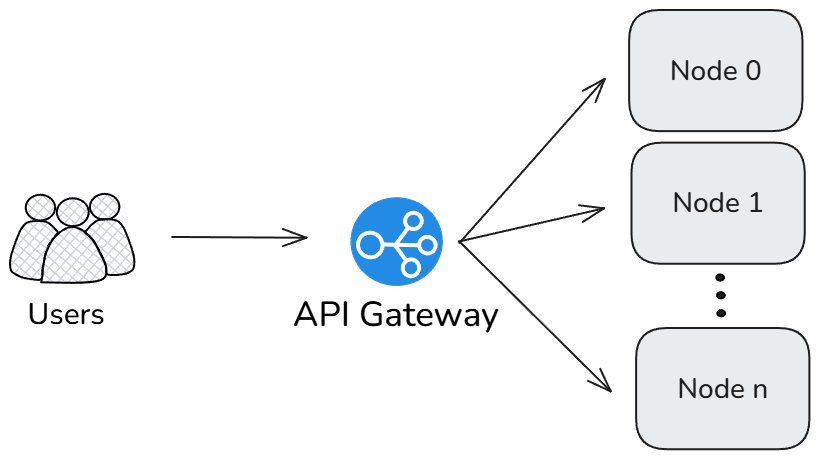
This solution implements a distributed LLM inference system with three main components:
Inference pool: Multiple inference nodes running vLLM or SGLang servers on AMD GPUs using tensor parallelism.
API gateway layer: A unified entry point that distributes requests across the inference pool. This guide demonstrates two options:
Monitoring layer: Prometheus and Grafana for comprehensive metrics collection and visualization, with additional load testing tools.
This architecture allows horizontal scaling by adding more inference nodes while maintaining a single API endpoint for client applications. This architecture supports various model sizes:
Small models: Can run efficiently on a single GPU.
Medium models: Typically require two or more GPUs with tensor parallelism.
Large models: Requires multi-node deployments for high availability and performance.
Tensor Parallelism distributes model layers across multiple GPUs, allowing inference of models too large to fit in a single GPU’s memory. The --tensor-parallel-size (-tp) parameter determines how many GPUs will share the model weights.
Logical diagram#
Prerequisites#
Multiple ROCm-compatible nodes with AMD GPUs.
Docker and Docker Compose installed on all nodes.
Network connectivity between nodes.
Models downloaded to a shared or local storage location.
NUMA configuration#
For optimal performance, disable automatic NUMA balancing on each node before starting the inference servers:
# Disable automatic NUMA balancing
sudo sh -c 'echo 0 > /proc/sys/kernel/numa_balancing'

# Verify NUMA balancing is disabled (should return 0)
cat /proc/sys/kernel/numa_balancing
Deployment#
This section provides step-by-step instructions for deploying components for multi-node inference load balancing.
Project structure#
/llm-cluster/
├── nodes/                 # Inference node files
│   ├── docker-compose.yml
├── gateway/               # API Gateway/Load Balancer files
│   ├── litellm
│   │   ├── config.yaml
│   │   └── docker-compose.yml
│   └── nginx
│       ├── docker-compose.yml
│       └── nginx.conf
├── monitoring/            # Monitoring stack files
│   ├── docker-compose.yml
│   ├── grafana/
│   │   ├── datasources.yml
│   │   ├── Instinct_Dashboard.json
│   │   └── vLLM_Dashboard.json
│   ├── influxdb/
│   ├── prometheus/
│   │   └── prometheus.yml
│   └── scripts/
│       ├── chat-completions-test.js
│       ├── helpers/
│       │   └── openaiGeneric.js
│       ├── prompt-length-test.js
│       ├── ramp-up-test.js
│       └── stress-test.js
Inference pool setup#
Perform these actions on each inference node.
Create the directory structure:
mkdir -p ~/llm-cluster/nodes
cd ~/llm-cluster/nodes
Create a
.envfile in thenodes/folder the with appropriate configuration for your environment:NODE_ID=node1 # Unique identifier for this node MODEL_PATH=/path/to/models # Path to local or shared model storage MODEL_NAME=Llama-3.1-8B-Instruct # Model to deploy TP_SIZE=4 # Tensor parallelism degree (number of GPUs to use) GPU_DEVICES=0,1,2,3 # GPU devices to use PORT=8000 # Port to expose the inference API SHM_SIZE=32GB # Shared memory size for container
Create a
docker-compose.ymlfile for the inference nodes. Two options are provided below for different inference backends.vLLM example
services:
  vllm:
    image: rocm/vllm:instinct_main
    container_name: vllm_${NODE_ID:-node1}
    shm_size: ${SHM_SIZE:-32GB}
    ipc: host
    network_mode: host
    devices:
      - /dev/kfd
      - /dev/dri
    group_add:
      - video
    security_opt:
      - seccomp=unconfined
    volumes:
      - ${MODEL_PATH}:/data/models
    environment:
      - ROCR_VISIBLE_DEVICES=${GPU_DEVICES:-0,1,2,3}
    command: >
      vllm serve /data/models/${MODEL_NAME}
      --dtype float16
      --tensor-parallel-size ${TP_SIZE:-4}
      --port ${PORT:-8000}
    restart: unless-stopped
SGLang example
services:
  sglang:
    image: lmsysorg/sglang:v0.4.6.post2-rocm630
    container_name: sglang_${NODE_ID:-node1}
    shm_size: ${SHM_SIZE:-32GB}
    ipc: host
    network_mode: host
    devices:
      - /dev/kfd
      - /dev/dri
    group_add:
      - video
    security_opt:
      - seccomp=unconfined
    volumes:
      - ${MODEL_PATH}:/data/models
    environment:
      - ROCR_VISIBLE_DEVICES=${GPU_DEVICES:-0,1,2,3}
      - RCCL_MSCCL_ENABLE=0
      - CK_MOE=1
      - HSA_NO_SCRATCH_RECLAIM=1
    command: >
      python3 -m sglang.launch_server
      --model /data/models/${MODEL_NAME}
      --tp ${TP_SIZE:-4}
      --trust-remote-code
      --port ${PORT:-8000}
      --enable-metrics
    restart: unless-stopped
Start the inference services:
docker compose up -d
API gateway setup#
On the API gateway node, create the gateway directory structure:
mkdir -p ~/llm-cluster/gateway
cd ~/llm-cluster/gateway
Choose one of the following gateway options based on your requirements.
Option 1: LiteLLM-based load balancer#
LiteLLM provides specialized routing, load balancing, and observability for LLM API calls, supporting multiple LLM providers and models through a unified OpenAI-compatible interface.
Create
docker-compose.ymlfor LiteLLM:services: litellm: image: ghcr.io/berriai/litellm:main-stable container_name: litellm_gateway network_mode: host volumes: - ./config.yaml:/app/config.yaml command: ["--config", "/app/config.yaml", "--port", "4000", "--num_workers", "8"] environment: LITELLM_MASTER_KEY: "${LITELLM_MASTER_KEY}" env_file: .env restart: unless-stopped logging: driver: "json-file" options: max-size: "10m" max-file: "3"
Create
config.yamlto define the model routing configuration:model_list: - model_name: DeepSeek-R1 litellm_params: model: openai/deepseek-ai/DeepSeek-R1 api_base: http://node0:8000/v1 - model_name: DeepSeek-R1 litellm_params: model: openai/deepseek-ai/DeepSeek-R1 api_base: http://node1:8000/v1 # Add additional nodes as needed # - model_name: DeepSeek-R1 # litellm_params: # model: openai/deepseek-ai/DeepSeek-R1 # api_base: http://nodeN:8000/v1 # Configure load balancing router_settings: routing_strategy: least-busy # Distributes requests to least busy nodes num_retries: 3 # Number of retries if a request fails timeout: 300 # Request timeout in seconds
Create
.envfile with your API key:LITELLM_MASTER_KEY=sk-1234
Note
For production environments, replace the default key with a strong, randomized value.
Start the LiteLLM gateway:
docker compose up -d
Verify that all LLM endpoints are healthy:
curl -X 'GET' \
'http://localhost:4000/health' \
-H 'accept: application/json' \
-H 'Authorization: Bearer sk-1234' | jq
Expected output
{
"healthy_endpoints": [
   {
      "model": "openai/deepseek-ai/DeepSeek-R1",
      "api_base": "http://node0:8000/v1"
   },
   {
      "model": "openai/deepseek-ai/DeepSeek-R1",
      "api_base": "http://node1:8000/v1"
   },
   {
      "model": "openai/deepseek-ai/DeepSeek-R1",
      "api_base": "http://node2:8000/v1"
   },
   {
      "model": "openai/deepseek-ai/DeepSeek-R1",
      "api_base": "http://node3:8000/v1"
   }
],
"unhealthy_endpoints": [],
"healthy_count": 4,
"unhealthy_count": 0
}
LiteLLM monitoring options#
LiteLLM provides several monitoring and observability options:
Basic logging: Available in the open source version, provides request/response logging and basic metrics
Callback integrations: LiteLLM supports custom callbacks for advanced monitoring with tools like:
This guide uses the open source version of LiteLLM with an internal Prometheus/Grafana stack for system-level monitoring. If you need LLM-specific tracing and observability, consider exploring the callback integrations.
Option 2: Nginx-based load balancer#
Nginx provides a high-performance, scalable HTTP server and reverse proxy that can efficiently distribute traffic across multiple inference nodes.
Create
nginx.confwith the following configuration:worker_processes auto; worker_rlimit_nofile 65535; events { worker_connections 65535; } http { include mime.types; default_type application/octet-stream; sendfile on; keepalive_timeout 65; # Define upstream server group upstream vllm_pool { # Use least_conn for distributing traffic based on least number of current connections least_conn; # Add inference server entries - update with your node hostnames/IPs server node0:8000; server node1:8000; # Add additional nodes as needed # server nodeN:8000; keepalive 32; } server { listen 80; # Health check endpoint location /health { return 200 'healthy\n'; add_header Content-Type text/plain; } # API endpoint for frontend clients location / { proxy_pass http://vllm_pool; proxy_http_version 1.1; proxy_set_header Connection ""; proxy_set_header Host $host; proxy_set_header X-Real-IP $remote_addr; proxy_set_header X-Forwarded-For $proxy_add_x_forwarded_for; # Timeouts for long-running inference requests proxy_connect_timeout 300s; proxy_read_timeout 300s; proxy_send_timeout 300s; # Buffer settings for large responses proxy_buffer_size 16k; proxy_buffers 8 16k; proxy_busy_buffers_size 32k; } } }Create
docker-compose.ymlfor Nginx:services: nginx: image: nginx:latest container_name: nginx_gateway network_mode: host volumes: - ./nginx.conf:/etc/nginx/nginx.conf:ro restart: unless-stopped logging: driver: "json-file" options: max-size: "10m" max-file: "3"
Start the Nginx gateway:
docker compose up -d
Monitoring Nginx gateway#
To enable monitoring for your Nginx gateway, add the nginx-prometheus-exporter:
Update
docker-compose.ymlto include the exporter:services: nginx: # ...existing nginx configuration... nginx-exporter: image: nginx/nginx-prometheus-exporter:latest container_name: nginx_exporter command: - --nginx.scrape-uri=http://localhost/stub_status network_mode: host restart: unless-stopped depends_on: - nginx
Add a status endpoint to
nginx.confinside the server block:location /metrics { stub_status on; access_log off; allow 127.0.0.1; deny all; }
Monitoring stack setup#
Perform these steps on the monitoring node.
Create the monitoring directory structure:
mkdir -p ~/llm-cluster/monitoring/{prometheus,grafana,influxdb}
cd ~/llm-cluster/monitoring
Set appropriate permissions for Grafana and InfluxDB data directories:
# Set permissions to allow container processes to write data
chmod 777 ~/llm-cluster/monitoring/grafana
chmod 777 ~/llm-cluster/monitoring/influxdb
Create
docker-compose.ymlfor the monitoring stack:services: # Check https://hub.docker.com/r/rocm/device-metrics-exporter/tags for the latest version device-metrics-exporter: image: rocm/device-metrics-exporter:v1.3.0-beta.1 container_name: device-metrics-exporter restart: unless-stopped group_add: - video volumes: - ./config.json:/etc/metrics/config.json devices: - /dev/kfd - /dev/dri ports: - "5000:5000" prometheus: image: prom/prometheus:latest container_name: prometheus volumes: - ./prometheus/prometheus.yml:/etc/prometheus/prometheus.yml command: - '--config.file=/etc/prometheus/prometheus.yml' ports: - "9090:9090" restart: unless-stopped influxdb: image: influxdb:1.11.8 container_name: influxdb ports: - "8086:8086" environment: - INFLUXDB_DB=k6 - INFLUXDB_ADMIN_USER=admin - INFLUXDB_ADMIN_PASSWORD=admin volumes: - ./influxdb:/var/lib/influxdb grafana: image: grafana/grafana:latest container_name: grafana volumes: - ./grafana/datasources.yml:/etc/grafana/provisioning/datasources/datasources.yml - ./grafana:/var/lib/grafana environment: - GF_SECURITY_ADMIN_PASSWORD=${GRAFANA_ADMIN_PASSWORD:-admin} ports: - "3000:3000" depends_on: - prometheus restart: unless-stopped
Create
prometheus/prometheus.ymlto configure metrics collection:global: scrape_interval: 15s scrape_configs: # Host OS metrics - job_name: 'node' static_configs: - targets: ['localhost:9100'] # Inference servers - job_name: 'vllm' metrics_path: /metrics scrape_interval: 15s static_configs: - targets: ['node0:8000', 'node1:8000'] # Add additional nodes as needed labels: service: 'vllm' # Nginx Gateway metrics (if using Nginx with nginx-prometheus-exporter) - job_name: 'nginx' scrape_interval: 15s metrics_path: /metrics static_configs: - targets: ['localhost:9113'] relabel_configs: - source_labels: [__address__] target_label: instance replacement: 'nginx-gateway' # AMD GPU device metrics - job_name: 'amd_gpu_metrics' scrape_interval: 5s metrics_path: /metrics static_configs: - targets: ['node0:5000', 'node1:5000'] labels: service: 'amd_gpu_metrics'
Note
Replace
node0andnode1with the actual hostnames or IP addresses of your inference nodes. When running Prometheus in a docker container, change instances oflocalhosttohost.docker.internal.Create
grafana/datasources.ymlto configure the Prometheus data source:apiVersion: 1 datasources: - name: Prometheus type: prometheus access: proxy url: http://prometheus:9091 isDefault: true - name: InfluxDB type: influxdb access: proxy url: http://influxdb:8086 database: k6 user: admin password: admin editable: true
Start the monitoring services:
docker compose up -d
Testing and performance evaluation#
Once your multi-node inference system is deployed, you can validate its functionality and evaluate its performance.
Testing with LiteLLM gateway#
Send a test request to the LiteLLM endpoint:
curl http://localhost:4000/v1/completions \
  -H "Content-Type: application/json" \
  -H "Authorization: Bearer sk-1234" \
  -d '{"model": "DeepSeek-R1", "prompt": "What is AMD Instinct?", "max_tokens": 256, "temperature": 0.0}'
Testing with Nginx gateway#
Send a test request to the Nginx endpoint:
curl http://localhost/v1/completions \
  -H "Content-Type: application/json" \
  -d '{"model": "DeepSeek-R1", "prompt": "What is AMD Instinct?", "max_tokens": 256, "temperature": 0.0}'
Expected output format (content may vary):
{
  "text": [
    "What is AMD Instinct? AMD Instinct is a line of high-performance computing (HPC) and
    artificial intelligence (AI) accelerators designed for datacenter and cloud computing
    applications. It is based on AMDs Radeon Instinct architecture, which is optimized for HPC
    and AI workloads. AMD Instinct accelerators are designed to provide high-performance
    computing and AI acceleration for a wide range of applications, including scientific simulations,
    data analytics, machine learning, and deep learning.

    AMD Instinct accelerators are based on AMDs Radeon Instinct architecture, which is designed
    to provide high-performance computing and AI acceleration. They are built on a 7nm process node
    and feature a high-performance GPU core, as well as a large amount of memory and bandwidth to
    support high-performance computing and AI workloads.

    AMD Instinct accelerators are designed to be used in a variety of applications, including:
    Scientific simulations: AMD Instinct accelerators can be used to accelerate complex scientific
    simulations, such as weather forecasting, fluid dynamics, and molecular dynamics.
    Data analytics: AMD Instinct accelerators can be used to accelerate data analytics workloads,
    such as data compression, data encryption, and data mining.
    Machine learning: AMD Instinct accelerators can be used to accelerate machine learning workloads"
  ]
}
Performance testing with Apache Bench#
Apache Bench (ab) is a lightweight tool for benchmarking HTTP servers, ideal for quick performance evaluation.
Installation options#
Option 1: Install Apache Bench Locally
sudo apt-get update
sudo apt-get install apache2-utils
Option 2: Run Apache Bench in a Container
docker run -it --rm \
  --shm-size=8GB \
  --ipc=host \
  --network=host \
  --entrypoint bash \
  ubuntu/apache2:2.4-22.04_beta
Running Apache Bench tests#
Create a request payload file:
cat > postdata << EOF
{"model": "DeepSeek-R1", "prompt": "What is AMD Instinct?", "max_tokens": 256, "temperature": 0.0}
EOF
Run the benchmark with desired concurrency and request count:
ab -n 1000 -c 100 -T application/json -p postdata -H "Authorization: Bearer sk-1234" http://localhost:4000/v1/completions
Key parameters:
-n 1000: Total number of requests to perform-c 100: Number of concurrent requests-T application/json: Content-type header for POST data-p postdata: File containing data to POST-H: Additional header for authentication
Sample performance test commands#
Here are examples of commands to test different models and configurations:
# Test with Llama-3.1-8B-Instruct
ab -n 20000 -c 2000 -T application/json -p postdata http://localhost:80/v1/completions

# Test with Llama-3.1-405B-Instruct
ab -n 20000 -c 2000 -T application/json -p postdata http://localhost:80/v1/completions

# Test with DeepSeek-R1
ab -n 20000 -c 2000 -T application/json -p postdata http://localhost:80/v1/completions
Advanced load testing with k6#
For more sophisticated load testing scenarios, Grafana k6 offers enhanced capabilities including detailed metrics collection and realistic user simulation. The test scripts used in this section are available to download from ROCm/gpu-cluster-networking
Installing k6#
Option 1: Install k6 locally
apt install -y k6
For additional installation options, refer to the official k6 installation guide.
Option 2: Run k6 in a Container
docker run --rm -i \
  --network=host \
  -v ${PWD}/scripts:/scripts \
  -e "OPENAI_URL=http://localhost:4000" \
  -e "API_KEY=sk-1234" \
  -e "MODEL_NAME=DeepSeek-R1" \
  grafana/k6 run /scripts/chat-completions-test.js
Setting up k6#
Configure environment variables for the test scripts:
cd ~/llm-cluster/monitoring/scripts
cat > .env << EOL
export OPENAI_URL=http://localhost:4000  # Use your LiteLLM or Nginx endpoint
export API_KEY=sk-1234                   # API key if required by your gateway
export MODEL_NAME=DeepSeek-R1            # Your deployed model name
EOL

source .env
Running k6 test scripts#
The repository includes several specialized test scripts for different testing scenarios:
Chat completions test#
k6 run --out influxdb=http://localhost:8086/k6 chat-completions-test.js
Ramp-up test#
k6 run --out influxdb=http://localhost:8086/k6 ramp-up-test.js
Stress test#
k6 run --out influxdb=http://localhost:8086/k6 stress-test.js
Prompt length test#
k6 run --out influxdb=http://localhost:8086/k6 prompt-length-test.js
On completion, k6 will provide a summary similar to this:
$ k6 run --out influxdb=http://localhost:8086 scripts/chat-completions-test.js

         /\      Grafana   /‾‾/
    /\  /  \     |\  __   /  /
   /  \/    \    | |/ /  /   ‾‾\
  /          \   |   (  |  (‾)  |
 / __________ \  |_|\_\  \_____/

     execution: local
        script: scripts/chat-completions-test.js
        output: InfluxDBv1 (http://localhost:8086)

     scenarios: (100.00%) 1 scenario, 5 max VUs, 1m30s max duration (incl. graceful stop):
              * default: 5 looping VUs for 1m0s (gracefulStop: 30s)

  █ THRESHOLDS

    http_req_duration
    ✓ 'p(95)<5000' p(95)=1.66s

    http_req_failed
    ✓ 'rate<0.01' rate=0.00%


  █ TOTAL RESULTS

    checks_total.......................: 170     2.64314/s
    checks_succeeded...................: 100.00% 170 out of 170
    checks_failed......................: 0.00%   0 out of 170

    ✓ is status 200
    ✓ has valid JSON response

    CUSTOM
    completion_tokens...................: avg=100       min=100      med=100       max=100       p(90)=100       p(95)=100
    prompt_tokens.......................: avg=26        min=26       med=26        max=26        p(90)=26        p(95)=26
    tokens_per_second...................: avg=83.173393 min=57.87037 med=87.565674 max=91.324201 p(90)=90.546921 p(95)=90.810037
    total_tokens........................: avg=126       min=126      med=126       max=126       p(90)=126       p(95)=126

    HTTP
    http_req_duration...................: avg=1.21s     min=1.09s    med=1.14s     max=1.72s     p(90)=1.44s     p(95)=1.66s
      { expected_response:true }........: avg=1.21s     min=1.09s    med=1.14s     max=1.72s     p(90)=1.44s     p(95)=1.66s
    http_req_failed.....................: 0.00% 0 out of 85
    http_reqs...........................: 85    1.32157/s

    EXECUTION
    iteration_duration..................: avg=3.67s     min=2.16s    med=3.62s     max=5.35s     p(90)=4.82s     p(95)=4.96s
    iterations..........................: 85    1.32157/s
    vus.................................: 1     min=1       max=5
    vus_max.............................: 5     min=5       max=5

    NETWORK
    data_received........................: 87 kB 1.3 kB/s
    data_sent............................: 31 kB 477 B/s

running (1m04.3s), 0/5 VUs, 85 complete and 0 interrupted iterations
default ✓ [======================================] 5 VUs  1m0s
Viewing k6 test results#
After running the tests, you can view the results in Grafana:
Open Grafana at
http://<your-monitoring-node-ip>:3000Log in with your credentials (default: admin/admin, unless changed via
GRAFANA_ADMIN_PASSWORDenvironment variable)Access the k6 dashboard by importing the dashboard ID
14801or by navigating to the pre-configured dashboard if available. The dashboard can be found at: https://grafana.com/grafana/dashboards/14801-k6-dashboard/
The k6 dashboard provides detailed metrics about request rates, response times, errors, and other performance indicators that help you understand your system’s behavior under load.
Monitoring and visualization#
Available dashboards#
The monitoring stack includes pre-configured Grafana dashboards for comprehensive system visibility. These dashboards are provided in the repository’s examples/llm-cluster/monitoring/grafana directory:
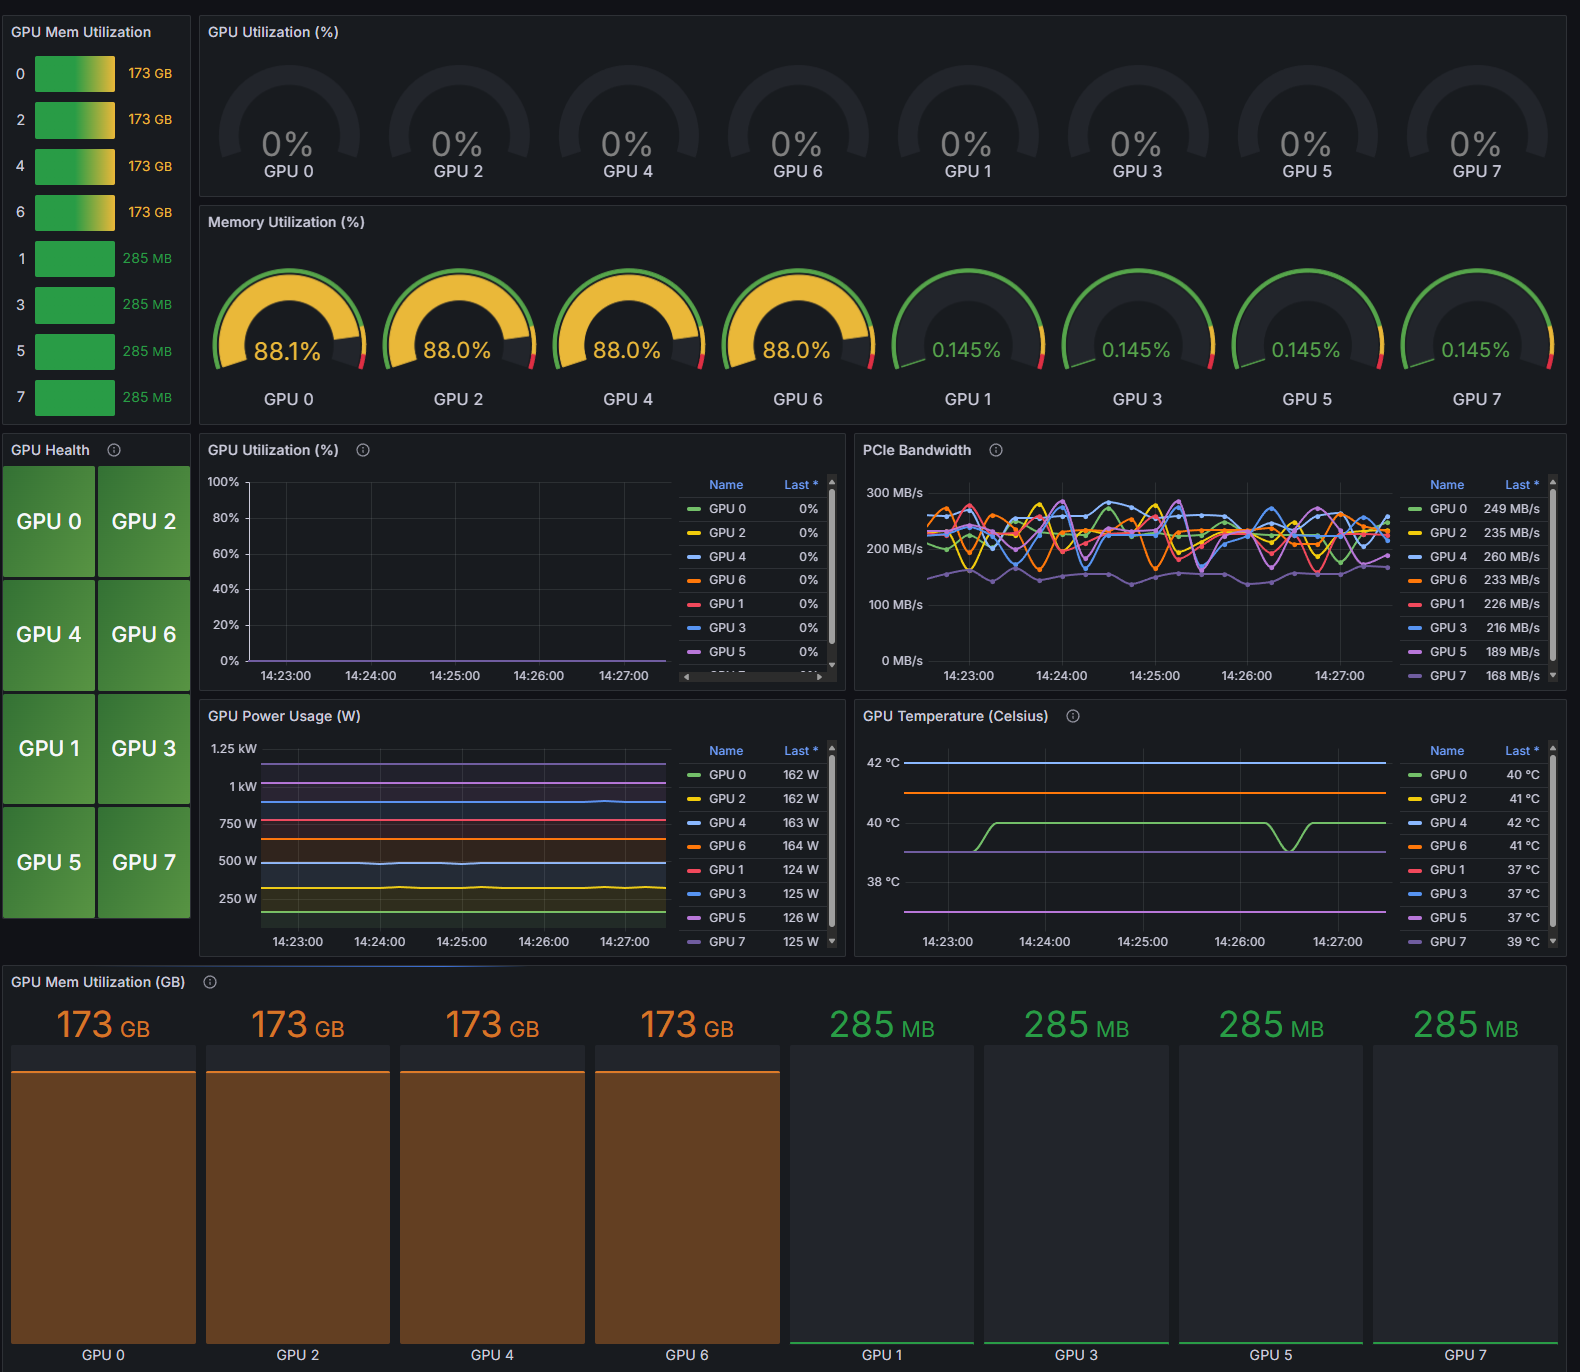
AMD Instinct dashboard (Instinct_Dashboard.json): Monitors GPU performance metrics including temperature, utilization, memory usage, and power consumption. Also available at AMD Instinct Single Node Dashboard.
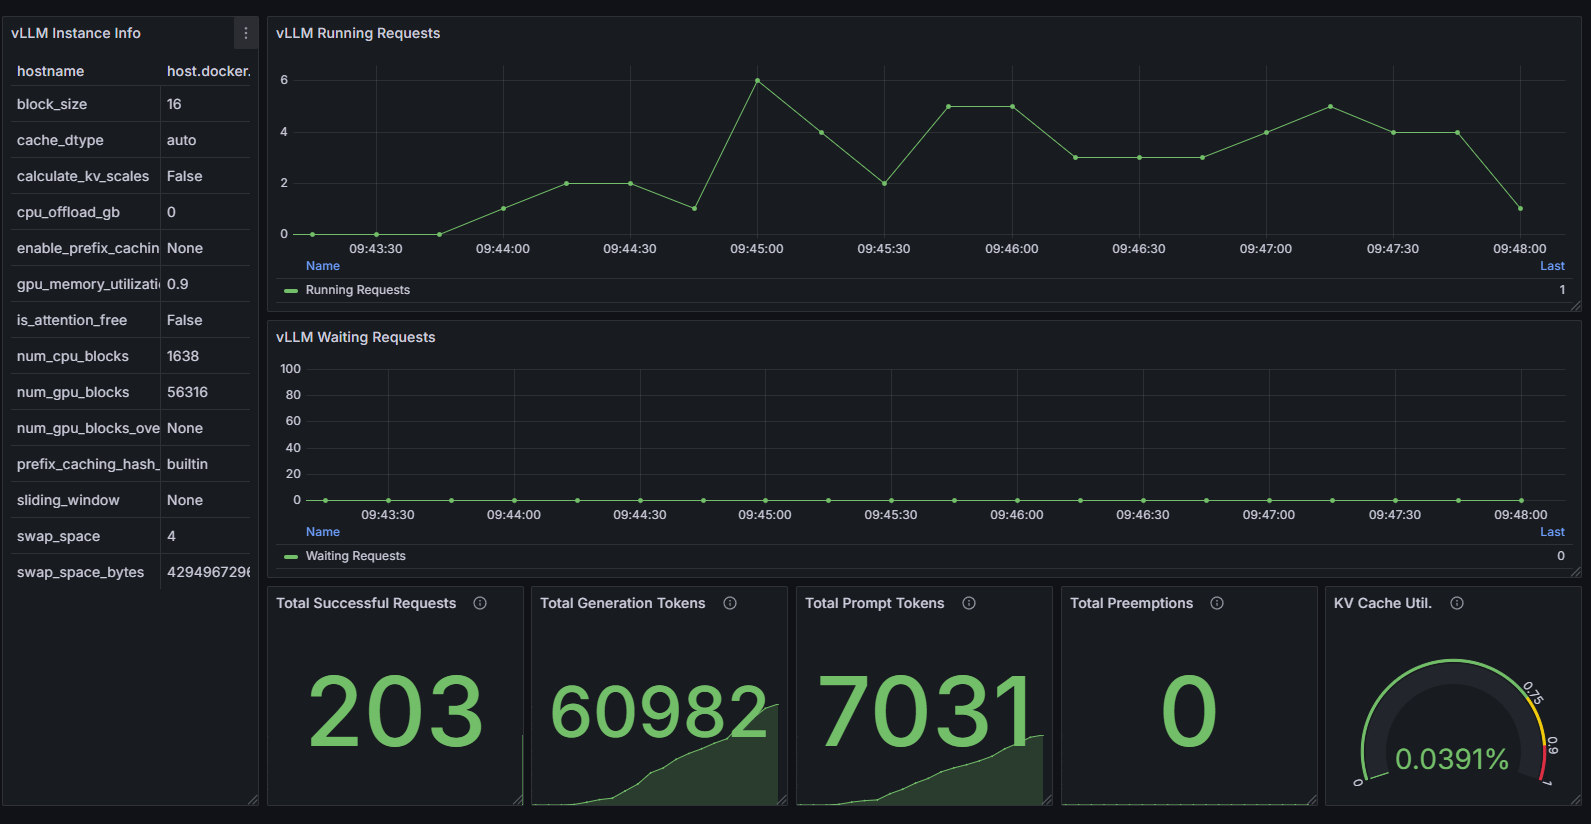
vLLM dashboard (vLLM_Dashboard.json): Provides insights into vLLM server performance, including request throughput, latency metrics, and queue statistics.
Additional recommended dashboards for comprehensive monitoring:
k6 dashboard: Visualizes load test results with detailed performance metrics. Available for import into Grafana with ID
14801or at https://grafana.com/grafana/dashboards/14801-k6-dashboard/.vLLM reference dashboard: Official dashboard from the vLLM project for detailed inference metrics. Available at vllm-project/vllm.
NGINX dashboard: Official dashboard for the NGINX Prometheus exporter. https://grafana.com/grafana/dashboards/12767-nginx/
For instructions on importing dashboards into your Grafana instance, follow the official Grafana Dashboard Import Guide.
Performance optimization recommendations#
Achieving optimal performance for your multi-node inference deployment requires experimentation and continuous monitoring. This section provides recommendations for tuning your setup based on your specific workload characteristics.
Compare different configurations#
To identify the optimal setup for your specific use case, systematically test different configurations.
Load balancer options
LiteLLM: Generally provides better handling of LLM-specific requirements like streaming responses and specialized routing
Nginx: Often delivers higher raw throughput for simple completion requests and offers more configuration flexibility
Inference servers
Inference configuration
Test different tensor parallel sizes to find the optimal balance between throughput and latency.
Experiment with batch sizes (
--max-batch-sizein vLLM) to increase throughput for concurrent requests.Try different quantization options to improve memory efficiency.
Using historical performance data#
You can use the monitoring setup in this guide to review stored historical performance data and track changes over time:
Establish performance baselines
Run benchmark tests after initial setup to establish baseline performance metrics.
Document key metrics like tokens per second, request latency, and GPU utilization.
Track performance trends
Set up Grafana dashboards with time series views of key metrics.
Create alerts for significant deviations from established baselines.
System-level optimizations#
Beyond the application components themselves, consider these system-level optimizations:
Network configuration
Ensure nodes have sufficient network bandwidth for model weight synchronization.
Consider using dedicated network interfaces for inter-node communication.
Host OS tuning
Adjust kernel parameters related to networking and memory management.
The NUMA configuration mentioned earlier in this guide is just one example.
You can find more information on system optimization at these links:
System optimization guides: https://rocm.docs.amd.com/en/latest/how-to/system-optimization/index.html
Performance guides: https://rocm.docs.amd.com/en/latest/how-to/gpu-performance/mi300x.html
Instinct single node networking: https://instinct.docs.amd.com/projects/gpu-cluster-networking/en/latest/how-to/single-node-config.html
Instinct multi-node networking: https://instinct.docs.amd.com/projects/gpu-cluster-networking/en/latest/how-to/multi-node-config.html
Cost-performance balance#
When scaling your cluster, consider both performance and resource utilization:
Right-sizing
Use Grafana dashboards to identify under-utilized resources.
Scale the number of nodes based on actual usage patterns and SLAs.
Workload scheduling
Consider dedicating specific nodes to different models based on usage patterns.
Use metrics to identify peak usage times and scale accordingly.
By systematically testing configurations and leveraging the monitoring data, you can continuously optimize your multi-node inference setup to achieve the best balance of performance, reliability, and resource efficiency.
Repository resources#
All configuration files, scripts, and dashboards referenced in this guide are available in the ROCm GPU Cluster Networking GitHub repository:
The repository includes:
Docker Compose files for inference nodes (vLLM and SGLang examples)
API Gateway configurations (LiteLLM and Nginx examples)
Monitoring stack setup with Prometheus, Grafana, and InfluxDB
Grafana dashboards for AMD Instinct GPUs and vLLM
Benchmark scripts for Apache Bench and k6
Example configuration files and setup scripts